
A detailed infographic of various statistics and data
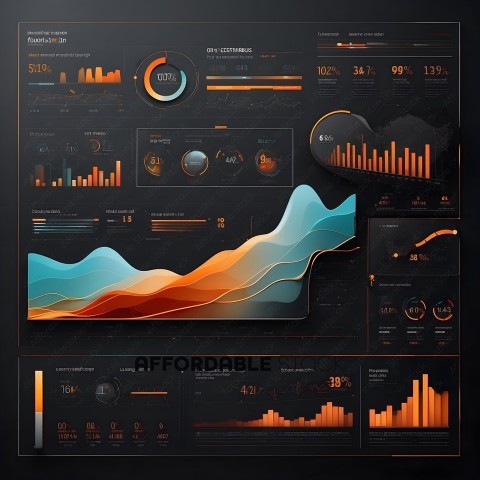
The image features a large, intricate, and visually stunning infographic that showcases various data and statistics. The infographic is divided into several sections, each containing different types of data and information. The background is a deep, rich orange color, which contrasts nicely with the lighter shades of the data points. The data points are displayed in a variety of shapes and sizes, with some appearing as small circles, while others are larger and more elongated. The shapes and colors of the data points vary, adding visual interest to the infographic. The infographic is accompanied by a series of graphs and charts, which further enhance the visual appeal of the piece. The graphs and charts are filled with data, and are displayed in a variety of colors and styles, creating a dynamic and engaging visual experience. Overall, the image is a striking and impressive display of data and information, with a strong focus on visual appeal and attention to detail.
Tags
data infographics charts graphs diagrams statistics visualization business analytics monitoring dashboard performance metrics datadriven decisionmaking insights business intelligence data visualizationSimilar Photos


- Details
- Photo #180747
- Published on Jun 08, 2024
- Photo type JPG
- Resolution 7168x7168
- Category Business / Finance
- File size 6MB