
Stock Market Data Visualization on Blackboard
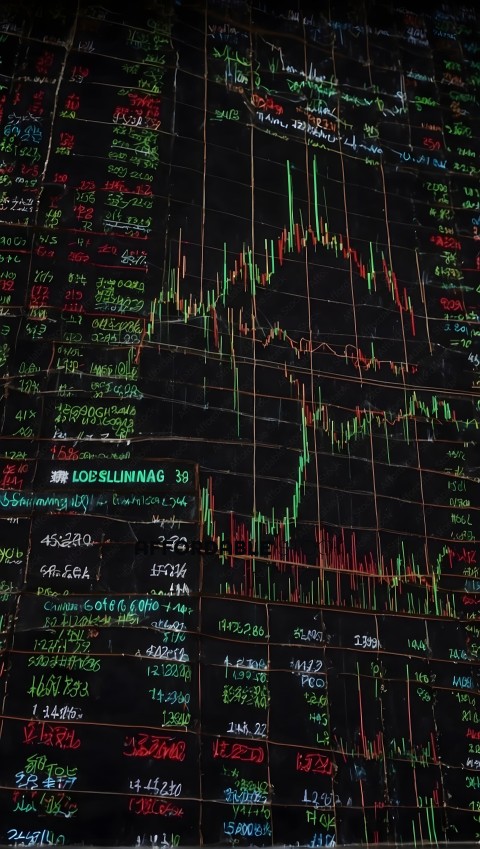
A blackboard filled with colorful stock market data, depicting candlestick charts and various financial figures written in chalk. This image visually represents the complexities of stock trading and market analysis, reflecting concepts of economy, risk, investment, and financial education.
Tags
stock market trading data analysis finance investment economic figures blackboard chalk candlestick chart technical analysis market trends financial data exchange numbers graph business wealth assets risk stock exchange market analysis performance economy trading concept financial background chalkboard portfolio reports stock data bull market bear market securities shares equity financial educationSimilar Photos
Two men looking at a chart with a graph

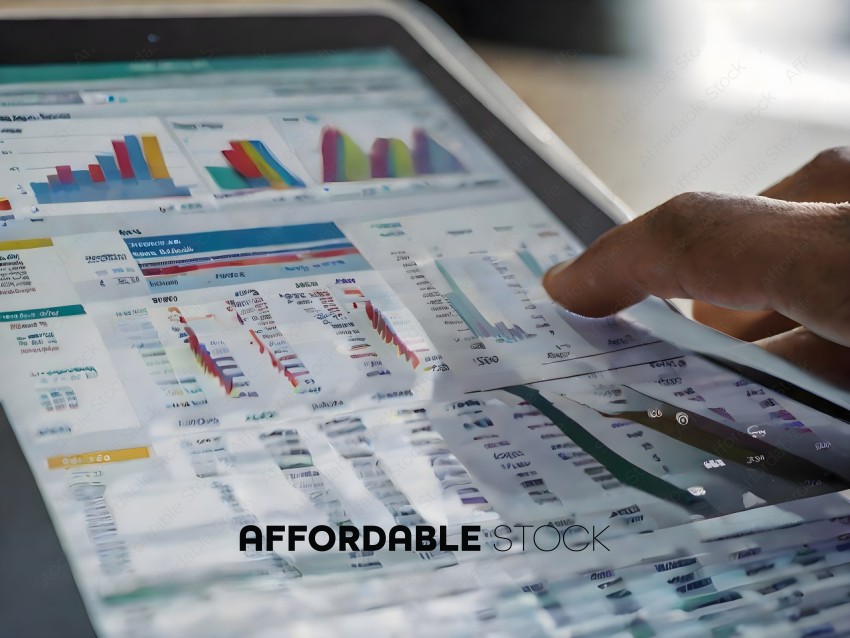
A person is using a tablet to look at financial data
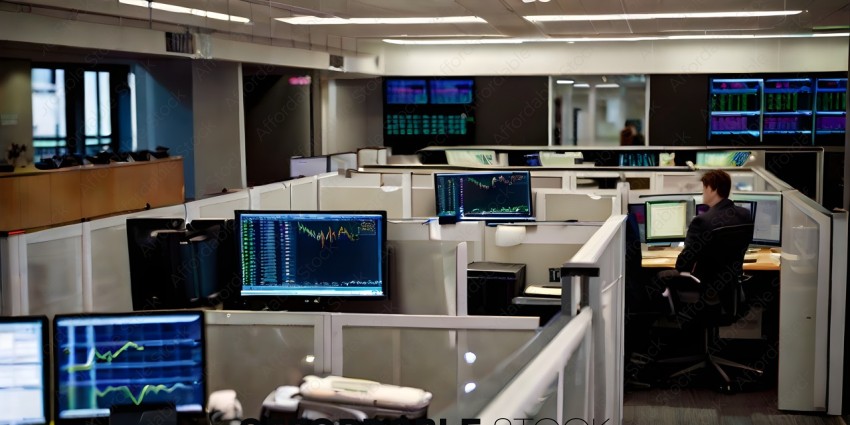
A group of computer monitors in a room
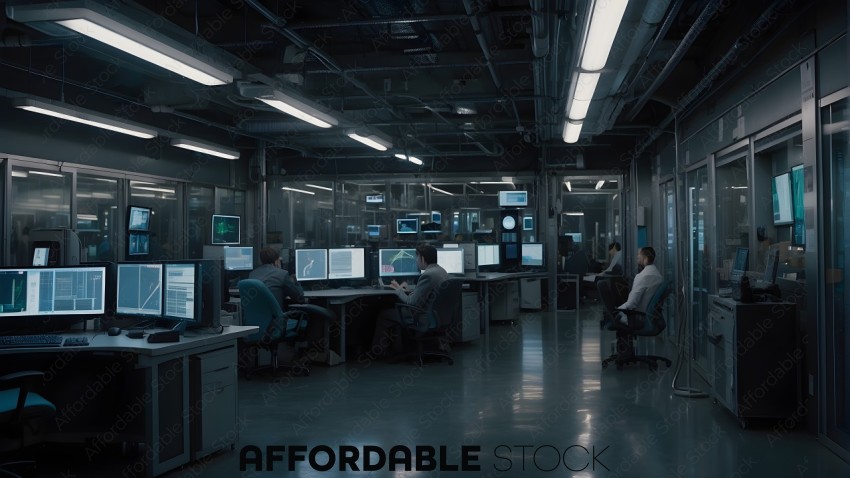
High-tech Office with Multiple Workstations and Operators
A man in a suit and tie is talking on a phone

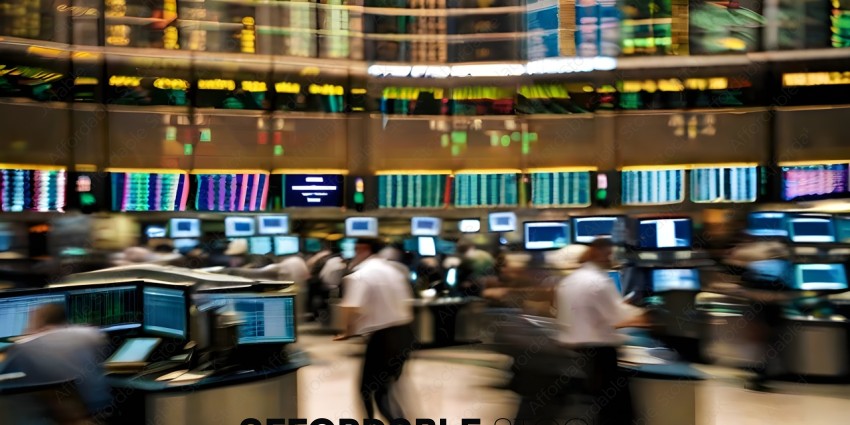
People in a busy stock exchange
A man in a suit and glasses standing in front of a chalkboard

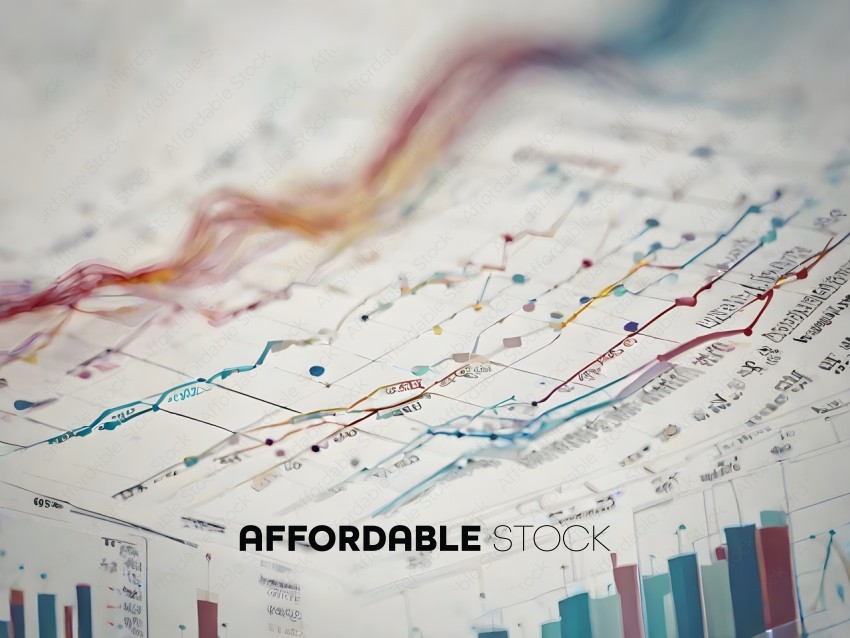
A graph with a lot of lines and numbers
A man wearing a headset and tie smiling

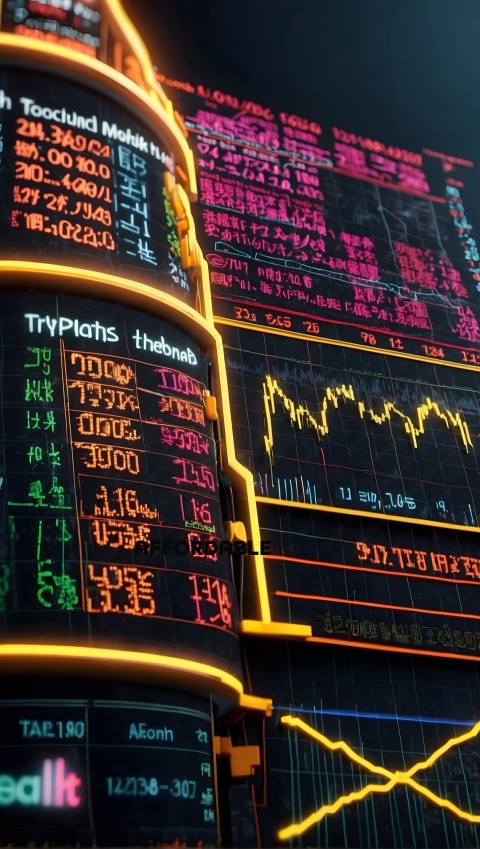
Futuristic Stock Market Display
- Details
- Photo #33476
- Published on Jan 30, 2024
- Photo type JPG
- Resolution 5376x9504
- Category Business / Finance
- File size 7.2MB